We assume that consumers are rational thinkers, and that they can rank their preferences. There are three parts to this 'rationality':
1- COMPLETE the consumer must either prefer good A to good B, good B to good A, or be indifferent
2- REFLEXIVE A is always as good as A. Preferences don't change based on exogenous variables
3- TRANSITIVE If A > B and B > C, then A > C
THESE SUBJECTIVE PREFERENCES ARE INDEPENDANT (EXOGENOUS).
-We cannot make comparisons between different people (because you can't compare my happiness to yours)
-We cannot make comparisons between different times
-This shows us that psychology is the basis of microeconomics!
HOKAY! Now that the background stuff is out of the way, let's actually look at one of these again.
FUNCTION OF A UTILITY CURVE: U = U(x,y) higher number = higher utility...

All of the different points on one indifference curve show different combined quantities of 2 goods (x and y) which yield a constant total utility.
Because the utility derived from any product is different for different people, the indifference curve shows PERSONAL PREFERENCES.
CHARACTERISTICS:
For any two products, there are an infinite number of indifference curves expanding outward. The total utility for each progressive curve is higher than the last one, because each progressive curve represents a greater combined quantity of goods x and y, and in most cases, we prefer to have MORE (more goods = greater total utility).
Two indifference curves for the same product cannot cross, because that would suggest that we can achieve the same total utility with a set combination of x and y as we could with the same quantity of x, but fewer of y. Also the point of intersection would imply two different total utilities for the same combination of goods. That's illogical.
EQUATION: Change in X (Marginal utility of X) + Change in Y (Marginal utility of Y) = 0
Why? Because if two points are on the same indifference curve, the utility lost on one axis is gained on the other axis.
utility lost = Change in X (Marginal utility of X)
utility gained = Change in Y (Marginal utility of Y)
The slope of the indifference curve = change in X/change in Y
OR
negative marginal utility of X/marginal utility of Y
OR
the marginal rate of substitution!
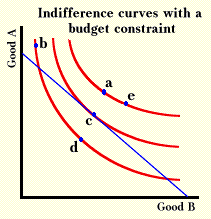
COMBINING BUDGET LINES AND INDIFFERENCE CURVES:
both budget lines and indifference curves have the same axes: quantities of different products. Budget lines show us possible combinations of different products, and indifference curve show us desired combinations of different products!

REMEMBER, price changes are represented as rotations or stretches of the budget line. SO, if the price of soda falls, the budget line for soda stretches out further along the x-axis, and the possible quantity of soda increases. Consumers want to maximize total utility, so places where the indifference line meets the budget line represent the demanded combinations of goods, given the prices of both products. As the prices of a good falls, consumers substitute into that good in order to reach higher indifference curves with the stretched budget line.
 .
.In this way, we can see the formation of a demand curve- consumers buy greater quantities of a product as the price decreases in order to maximize total utility (intersect with the highest indifference curve). This results in a negatively sloped demand curve.
-------------

No comments:
Post a Comment